The Italian Working Class throughout the capitalistic crisis


Guido Ricci, member of the CC Political Bureau, Alberto Lombardo, member of the CC Political Bureau for the theoretical section of the magazine “La Riscossa”, Communist Party (Italy)

The Communist Party, being the organized revolutionary vanguard of the working class, is expected to have strong ties with it, but sometimes the knowledge of the real situation of the working class is poor and superficial, often based on abstract, sometimes even dogmatic, concepts and stereotypes. The lack of knowledge of quantitative data and their trend over time prevents from understanding the processes and tendencies underway, from identifying the real needs of the working class, from keeping the theoretical elaboration in step with the development of reality and, therefore, from adopting a coherent and effective political line.

This article is a modest attempt to favor the knowledge of the real situation of the working class in Italy, bearing in mind that a constant and careful monitoring is necessary, since reality changes quickly and continuously.

1. Dynamics of employment in general

Let’s first take into consideration the dynamics of employment in general, as shown in the following tables and charts, in order to understand the current trends and the overall economic environment, in which the working class currently lives and acts.

Tab. 1.1 – Economicallyactive population by macro-sector of activity


AGRICULTURE

INDUSTRY

SERVICES

TOTAL


thousands

index

thousands

index

thousands

index

thousands

index

2007

985.20

100.00

6,866.60

100.00

17,443.10

100.00

25,294.90

100.00

2008

963.40

97.79

6,821.90

99.35

17,563.90

100.69

25,349.20

100.21

2009

942.10

95.63

6,578.60

95.81

17,404.80

99.78

24,925.50

98.54

2010

959.50

97.39

6,382.10

92.94

17,424.10

99.89

24,765.70

97.91

2011

942.20

95.64

6,307.50

91.86

17,593.00

100.86

24,842.70

98.21

2012

918.70

93.25

6,148.10

89.54

17,698.00

101.46

24,764.80

97.90

2013

892.20

90.56

5,894.20

85.84

17,536.40

100.53

24,322.80

96.16

2014

893.30

90.67

5,774.60

84.10

17,678.60

101.35

24,346.50

96.25

2015

912.90

92.66

5,714.30

83.22

17,854.20

102.36

24,481.40

96.78

2016

926.80

94.07

5,688.60

82.84

18,206.30

104.38

24,821.70

98.13

2017

919.30

93.31

5,720.10

83.30

18,466.10

105.86

25,105.50

99.25

Source: ISTAT, our elaboration

Source: ISTAT, our elaboration

Chart 1.2 – Economically active population by macro-sector of activity. Variation over time (index 2007 = 100)

ICR-09-ITA01-EN

First of all, we must take into consideration that ISTAT identifies the concept of economically active population with that of labor supply. In reality the two concepts are different, from a class point of view. According to ISTAT, the active population is composed by all those, who are in working age and in condition to work, regardless of the fact, if they are currently really performing an economic activity or not. Therefore this concept includes also the owners of means of production and exchange. For us, instead, the labor supply is made up of all those who, having no ownership on the means of production and exchange, to live are obliged to work as employees or self-employed, or are looking for a job. Anyway, the dynamics of active population can help us to get an idea of the changes occurring in the distribution of employment among macro-sectors.

These concepts and the quantitative differences between macro-sectors will be recalled in chapter 2.

According to official data in Tab. 1.1 and Chart 1.2, if we consider the totality of the economic activities, active population has decreased by -0.75% compared to 2007, despite the growth in the sector of Services (+5.86%).

In the sector of Agriculture & Fishing the active population has steadily decreased during the period taken into account (-6.27% compared with 2007), probably due to the combined effect ofthe technological replacement of labor power, of the increase in labor productivity and of the transition ofshares of capital to the Services sector to take advantage of its growing profitability.

Active population in Industry sector has decreased by -16.7% compared to 2007. The capitalist crisis has strongly affected Industry, confirming to be a crisis of over-production and over-accumulation that is far from being totally overcome, but also the spread delocalization abroad of many productions has contributed to this negative result.

If we consider the dynamics of employment in terms of hours actually worked, as shown in Tab. 1.3 and Chart 1.4, we can see that, it decreased in Agriculture & Fishing by -11.68% and in Industry by -21.26% compared to 2007, while in the same period employment in Services has grown only by +1.05%. In the totality of economic activities employment decreased by -6.93% compared to the last year before the crisis. Except the macro-sector of Services, employment in all the other macro-sectors and in the totality of economic activities is strongly below its levels before the crisis.

Tab. 1.3 – Employment by actually worked hours and macro-sector of activity


AGRICULTURE

INDUSTRY

SERVICES

TOTAL


thousands

index

thousands

index

thousands

index

thousands

index

2007

2,709,942.10

100.00

12,912,100.40

100.00

30,367,945.30

100.00

45,989,987.80

100.00

2008

2,589,275.50

95.55

12,733,538.90

98.62

30,483,998.80

100.38

45,806,813.20

99.60

2009

2,535,110.30

93.55

11,713,504.40

90.72

30,010,626.90

98.82

44,259,241.60

96.24

2010

2,504,522.70

92.42

11,452,682.60

88.70

30,058,220.90

98.98

44,015,426.20

95.71

2011

2,416,626.60

89.18

11,380,431.10

88.14

30,255,419.50

99.63

44,052,477.20

95.79

2012

2,318,336.00

85.55

10,718,647.60

83.01

29,909,506.70

98.49

42,946,490.30

93.38

2013

2,297,820.50

84.79

10,178,436.40

78.83

29,346,979.80

96.64

41,823,236.70

90.94

2014

2,287,763.20

84.42

10,012,229.80

77.54

29,546,769.70

97.30

41,846,762.70

90.99

2015

2,359,409.20

87.06

10,013,244.60

77.55

29,853,686.10

98.31

42,226,339.90

91.82

2016

2,436,053.00

89.89

10,017,281.80

77.58

30,349,584.30

99.94

42,802,919.80

93.07

2017

2,393,501.70

88.32

10,167,569.10

78.74

30,685,946.90

101.05

43,247,017.10

93.07

Source: ISTAT, our elaboration

Source: ISTAT, our elaboration

Chart 1.4 – Employment by actually worked hours (index 2007 = 100)

ICR-09-ITA02-EN

From the above some considerations are to be drawn:

  • these data too confirm the nature of this capitalistic crisis as a crisis of over-production, affecting above all Industry as the sector where the material wealth is produced and where the effect of the crisis mix with those of the replacement of labor by new labor-saving technologies; as Marxists know well, the technological labor-saving replacement is also one of the contradictions of capitalism, generating the tendency of the rate of profit to falling;
  • if we measure employment in terms of actually worked hours, instead of thousands of people, we see that employment decrease turns out to be greater (or its increase to be smaller); the gap between these data measures the level of lies by bourgeois governments on this matter, and is due to the spread use of fixed-terms precarious bargaining agreements, particularly in Services sector; as an example, formally, when a worker signed a zero-hours agreement, statistics classify him among the working population, although he did not work even one hour during the year;
  • as we, the Communists, expected and denounced, the huge incentives, in terms of de-taxing, decontribution of social security charges, temporary public funding of new hired employees’ wages, promoted by left-centrist governments, have done nothing, but supported private capital by public resources, paid by workers-tax payers, confirming once more the parasitic nature of monopolistic capitalism; the current government 5Stars-Northern League, being a bourgeois government, announced the will to continue the same policy of public funding of new hiring by private companies: governments may be different, but if the class in power remains the same, no real changes are to be expected.

Chart 1.5 shows and compares the dynamics of the Economic Activity Rate (EAR, aka Labor Force Participation Rate, indicating the percentage of people in working age, older than 15, both employed and unemployed, out of the total population, regardless to their current working status; it represents the labor supply), the Employment Rate (ER, aka Employment-to-Population Ratio, the percentage of employed people out of the total population) and the Unemployment Rate (the percentage of labor supply that are looking for a job).

Chart 1.5 – Dynamics of the Economic Activity Rate, the Employment Rate and the Unemployment Rate (2005=100) [1]

ICR-09-ITA03-EN

The Economic Activity Rate, used by ISTAT to measure the variation in the labor supply, increased by +4.91% throughout the period considered and places itself slightly above its level before the crisis.

The Employment Rate decreases continuously after 2008, reaching its minimum in 2013 with a decrease by -5.28% compared to 2008; its current level is by -1.16% lower than before the crisis. Throughout the whole period considered, the ER decreased by -0.81%.

The Unemployment Rate has been constantly increasing from 2007 to 2014, when it reached its maximum value (+108.76% compared to 2007). After 2014 a slight recovery can be observed, but the Unemployment Rate in 2017 is still well above the level of 2007 (+84.52%), totally increasing by +45.02% throughout the whole period considered.

This means that, despite the timid recovery, the capitalist crisis has canceled a significant part of the productive forces, since the Employment Rate is placed below its value before the crisis, while an even more significant part of the labor supply can not find employment opportunities, as evidenced by the high Unemployment Rate, well above its value before the crisis. The combined effect of both the high labor supply (EAR) and the high unemployment rate (UR), as Marx explained, make wages fall or, at least, not increase.

In 2017, the Economic Activity Rate in Italy was 65.43%, while the Employment Rate was 57.96% and the Unemployment Rate was 11.21% (19.4% in Southern Italy). Particularly dramatic is young people’s unemployment: totally 34.7% for the age group 15-24 (37.3% for young women, 51.4% totally in Southern Italy, where unemployed young women are 55.6% of the labor supply.[2] The percentage of NEET (Not engaged in Education, Employment, Training) is the highest in Europe in the age group from 15-24 years (20%) and the second highest after Greece in the age group 25-29. Moreover, Italy has one of the highest unemployment rates (6,6 percent) in Europe for people with university degree.[3]

In front of these evidences, the lies crumble of both left-centrist and right-centrist bourgeois governments about the alleged success of their employment policies, that were nothing, but a further help for capital, using funds provided mostly by taxation over employed labor. It is clear, that capitalism today not only hampers the development of productive forces, but even destroys them, becoming more and more parasitic and unable to re-start accumulation without public funds and support.

2. The quantitative dimension of the working class in Italy

One of the arguments most frequently used by our class enemy and its servants opportunists is the alleged disappearance of the working class, due to both technological and “social” progress, where the latter would allegedly attenuate class differences to the point of canceling them, allowing even the poorest people's layers, thanks to the redistribution of the produced income, access consumption of goods and services, which were once the prerogative of the middle class. As a result, class struggle would lose its meaning on the background of a harmonious scenery of widespread middle class and social peace.

This argument, contradicted by theory and reality, is false and anti-scientific. It does not consider the evident difference, existing between exploited producers and exploiting parasites, and tries to hide class differences by merging everybody in the generic category of “consumers”.

From the theorical point of view, on the one hand, the class belonging is not determined on the basis of the level of consumption or income, which can vary quantitavely both cyclically and in the long run without affecting it qualitatively, but is established by the position one occupies with respect to private property and production relations, i.e. by social relationships between human beings that historically vary only when the mode of production changes. That means, that no redistribution of income is able to overcome the division into classes of society, as it does not affect production and property relations. On the other hand, technological progress and the related labor-saving changes in the process of production affect just the technical way in which the surplus-value is extracted, but does not modify the substance of the capitalistic relations of production, that is the extraction and the private appropriation by capitalists of socially produced surplus-value.

Assessing the real quantitative dimension of the working class in our country is not easy due to the following reasons:

  • the heavy weight of shadow economy: it is assessed that the 33% of the Italian GDP comes from illegal or not disclosed business;
  • the relevant spread of black labor;
  • the destructuration of the National Collective Bargaining Agreements and the use of atypical, fixed-term contracts cause rapid fluctuations of the employment level;
  • many workers are blackmailed and obliged to open a VAT position as individual indipendent entities, or as self-employed; officially they are registered as indipendent sub-contractors, but they are in all respects workers, totally depending on their employer and, moreover, deprived of any labor union protection;
  • labor unions are not present in all the factories, especially in micro- and small units with less than 15 workers, that are widely spread in Italy; due to this, even unions do not have enough information;
  • the data on this matter, provided by ISTAT (the Italian State Institute of Statistics) are based on what employers declare.

Therefore, official statistics unavoidably underestimate the real quantitative dimension of the working class.

The above is even more true with respect to agricultural laborers, due to the wide use of immigrated not disclosed workers. As an example of this fact, according to the bourgeois newspaper La Repubblica, in Italy, where 40% of the territory is assigned to agricultural use, at the beginning of 2018, there were 1,085,000 agricultural workers (590,000 or 54.38% in Southern Italy), more than reported by ISTAT, that contribute to the GDP for an average yearly amount of 133 billions euros (!). Among them, 33% are women, 36% are foreigners, concentrated mostly in Northern regions, where they make up 57% of the rural labor power. The overwhelming majority of them (942,000, that is 86%) work under fixed-term agreements, 34% of them work less than 51 days per year, with no social security nor welfare, and 15% of them even less than 10 days per year, mostly in Northern Italy. This confirms the very high degree of exploitation of these workers and the extreme precariousness of their job, but also demonstrates the enormous evasion from the payment of taxes and social charges by the landowners, who declare a ridiculous and non-credible number of hours worked.[4]

As told in chapter 1, page 2 of this article, in order to avoid possible misunderstandings, we specify the following values, reported by ISTAT:

  • economically active population in the 2nd quarter of 2018: 25,105,500
  • working population in the 2nd quarter of 2018: 23,476,000
  • salaried employees in the 2nd quarter of 2018: 18,083,567

As salaried employees we mean people earning a salary from working for an employer. In the English text, we use the term of “Workers” to indicate that part of salaried employees, that receive a wage in the Marxist meaning of it. We included into this category Apprentices and Home-based workers also. The data in Tab. 2.1, Chart 2.2 and Chart 2.3 consider as workers not only industry workers, but also waged labor power in other macro-sectors. Tab. 2.1 shows the partition of employees by professional position, also indicating the incidence of each professional category on the total and the variation over time of the number of employees by professional position, graphically shown in Chart 2.2.

Tab. 2.1 – Employees by professional position [5]

ICR-09-ITA13-EN

Chart 2.2 – Employees by professional position. Variation over time

ICR-09-ITA04-EN

As we can see from the data above, the number of workers decreases from the end of 2008 reaching its minimum at the end of 2011, then constantly grows in absolute value (+11.43% compared to 2011, +6.95% in the whole period), but its percentage out of the total of salaried employees decreases constantly until 2010, then starts rising with slight oscillations in more or less, finally making up 47.77% in the 2nd quarter of 2018. This decrease of weight, that sharpened during the crisis, but started well before it, is due to the combined effect of the technological replacement of labor power and the delocalization of certain productions. As only production is subjected to delocalization abroad, while the administrative staff, the management and the property, in the form of holding, remain in the country of origin, this reduction in number did not seriously affect the professional category of Clerks and only slightly affected the category of Managers: the first ones, after a decrease from 2011 to 2014, place themselves higher their level in 2011 and well above the base year level, while the second ones recovered from a decrease started in 2006 and their number increases by +16.2% compared to the base year, placing itself above its previous positive peak of 2011 by almost 2 percentage points. The capitalist restructuring process has greatly reduced the number of top corporate executives (-22.17% in 3 years, from 2008 to 2011, -12.17% in the entire period). This could be related not only to the need to face the crisis and cut the costs connected to the remuneration of an expensive and redundant category, but in this case also to the delocalization of some productions that has reduced the demand for these functions in the homeland. Overall, starting from 2015, there is a tendency to growth in the number of employees in general and in each professional category, except top corporate executives.

Even according to these underestimated official data, the working class makes up 47.77% of salaried employees, 36.80% of working population, and 14.28% of total population, remaining the major component of productive forces. The composition of salaried employees in the current year is shown in Chart 2.3.

Chart 2.3 – Composition of employees by professional position (2018, second quarter)

ICR-09-ITA05-EN

Considering these official data, the figures show that the working class is far from disappearing, as the class enemy and the opportunists claim. These data are clearly underestimated. As an example, statistics take into consideration only declared home-based workers, but everybody knows that this category of unprotected workers is larger than official figures tell, due to the wide use of black-market labor. The same is true for rural waged workers, whose assessment is extremely difficult for the same reasons. Moreover, we herein consider salaried employees, but we must remember that nowadays many workers are obliged by their employers to mask themselves as self-employed independent subcontractors. Because of these reasons, we can figure that the actual number of waged workers is significantly higher than official data show.

In our conception the working class, considered as currently working waged producers of material wealth, is a component of the proletariat in general. To get an idea of the number of proletarians we should add to the figures in Tab. 2.1 the number of workers that lost their job, the number of people seeking for a first job as workers, the number of retired workers, the number of “intellectual proletarians”. And what to say about the children of proletarians, that statistics classify as “inactive population”, along with the children of bourgeoisie? The capitalistic crisis harshly hit the middle classes and proletarianized a substantial part of it. For example, managers, clerks, teachers and other petty-bourgeois elements, laid off between the ages of 45 and 50, too old to find a new job, but too young to be eligible for retirement, do not join the ranks of the proletariat?

Official statistics do not have class-based criteria of classification. Because of this, it is extremely difficult to exactly quantify the actual number of proletarians in Italy. It is evident, that official statistics underestimate it, but it is as well evident, that the opportunistic theory on the alleged “extinction” of the working class and the proletariat is not supported by data and, therefore, completely false. This assertion is even more true if we move from the national to the international level. The possible decrease in the number of workers in the most economically developed countries may be accompanied by a more than proportional increase in the number of workers at a global level, because capital delocalizes production towards those countries, where labor costs and taxes are so low and laws so all-permissive that replacing the labor power by new technologies might become not convenient in the short run. This is the case of textile and shoes brands production, delocalized by transnational corporation in Pakistan, Indonesia and Vietnam.

So far, we examined the actual data on employees, on those who do not hold the ownership of the means of production and exchange (even if, in some cases, top executives and senior managers may hold shareholdings in capital). As Marxists, we do not forget that only the labor power produces surplus-value, from where, in addition to profit and other variables, the salary originates for the other categories of employees. Nevertheless, in the general struggle between producers of wealth and parasitic appropriators of the work of others, the working class must act to bring onto its positions these categories of employees, basically petty bourgeois, but anyway excluded from the private ownership of the means of production and oppressed by capital. This is a crucial moment, as the petty bourgeoisie oscillates between the bourgeoisie and the proletariat and, in certain historical conditions, may become the shock mass of the reaction. History demonstrates, that the working class can win only when it is able to develop a policy of social alliances, to form a block of forces antagonistic to the bourgeoisie and to uncompromisingly affirm its interests as universal.

From the point of view of territorial distribution, the working class is concentrated mainly in Northern Italy (51.77%), less in the South (27.97%) and in the Center (20.26%), as a consequence of the unequal industrial development within the country, which historically characterizes Italian capitalism. In addition to the gap between North and South Italy, we can also note the persistence of the gender gap, which is manifested in an attenuated way in terms of number, but significantly in terms of salary. Women make up 44.54% of total employees, 32.1% of top executive officers, 45.27% of managers, 57.65% of clerks and 34.37% of workers.[6] The average salary of a female worker with lower degree amounts to 64% of the salary of a male worker with the same degree. This gap decreases for female workers with high school diploma, that receive 72% of male workers' salary, but becomes again very high for women with university degree, receiving 66% of the salary of a man with equivalent degree.[7]

Available data by ISTAT confirm that the majority of employees (split data by professional position in particular are not available, but it is reasonable to assume that they more or less follow the trend and the distribution of employees in general) are still spread throughout micro and small business with 0 to 9 employees (45.35% in 2016, with tendency to decreasing over the time), while 22.06% of total employees work for large companies with more than 250 employees. The number of employees working for large companies shows a marked upward trend in the period from 2012 to 2016 (+1.78%), while the number of employees of micro, small and medium enterprises decreases or is stagnant. These data confirm the persistence of a historical weakness of Italian capitalism, that is the low degree of concentration of capitalistic production, however, also shows that the process of concentration of capital is in progress, even if slowly and with delay. The difficulty in organizing the working class is evident because of its dispersal in micro and small companies and its low concentration. This is aggravated by the fact that at companies with less than 15 people employed, trade unions do not have internal representation and the Charter of Workers (Law No. 300/1970) does not apply.

3. Wages, prices and profits.

The apologists of capitalism are endeavoring to convince public opinion that a reduction in wages is an inevitable consequence of the economic crisis, for overcoming which further privations are needed "in the interests of the country", as if the crisis were something inexplicable, alien to these production relations and without class connotations. This statement is very far from the truth.

Before anything else, we must stress that the crisis is not simply “the crisis of economy” with no specification, but it is the crisis of capitalistic economy, originated by capitalism contradictions and endemic in capitalistic relations of production. Moreover, in this scenario, talking about "the interests of the country" is incorrect and false, since the country is divided into antagonistic classes, which do not have and can not have common interests.

Due to the very nature of capitalistic relations of production (the inverse proportionality between wage and profit), capitalists have always been trying to compress wages, but as long as the USSR has existed, in order to prevent the radicalization of the working class’ struggle, capitalists were obliged to grant higher wages, benefits and welfare. Cold War has been the golden age of social democracy and its social compromise. Since the USSR disappeared, capitalists have completely restored their political power to impose profit as the only independent economic variable with no downward flexibility. Labor remunerations in all their forms, direct (wages), deferred (pensions), or indirect (social services), any other distribution of surplus value may be put into question, reduced and cut, excluding profit. The generalized competition among monopolies, imperialistic countries and blocks strengthened this trend and put an end to traditional social democratic policies of compromise and social peace.

An example of the above is provided by the acceleration of the European integration process after 1991. In Italy, this process and, above all, the entry into the system of euro as the single European currency, was carried out by reducing wages and imposing burdensome economic sacrifices on the working class and the other people’s layers. At that time, left-centrist governments were striving to present sacrifices as temporarily necessary for the sake of a bright future in a united Europe. History unveiled their lies. Since its very beginning integrated Europe has shown its true face of imperialistic conglomerate, an enemy to workers and peoples, aimed at intensifying the exploitation and the robbery on waged labor. Nothing positive came from the European integration process to the working class, but the constant worsening of their living conditions, well before the outbreak of the crisis.

In particular, in Italy the introduction of euro was implemented in a fraudulent way, by rigging the National accounts in order to formally meet Maastricht parameters while Italian economy was far from them. The loss of the possibility to use devaluation to increase competitiveness due to the fixed exchange rate (1 euro = 1,927.36 lira), the anti-inflationary policy of budgetary rigor that hit pensions and social services, and the weakening of class struggle by reformist labor unions, supporting the anti-workers measures carried out by left-centrist governments, have jointly dragged down wages before the outbreak of the crisis. Moreover, many prices were adjusted to euro at the rate of 1 to 1000, with no intervention by governments and prices supervisory bodies. The wages decrease caused a depression of the domestic demand that finally hit those sub-sectors that had most taken an unfair advantage from the conversion of prices from lira into euro (commerce, restaurants, bars and catering, etc.), dragging a part of the bourgeoisie too into the gorge of the crisis, but the net result of these processes has been a huge transfer of wealth from the people to big capital.

The last crisis has undoubtedly contributed to worsening the living conditions of workers, but it is not the first cause of wages decrease in the long run. Wage reduction is an unavoidable tendency under capitalistic relations of production, as Karl Marx taught us. Here we should synthetically recall the distinction by Marx between nominal (monetary) wage, real wage and proportional wage. The nominal wage is the amount of money the worker receives, the formal price of the labor power. The real wage is the amount of goods and services the worker can buy with his nominal wage. The proportional wage is considered in relation to profit, both being two of the components of the distribution of the surplus-value produced, and measures the dynamics of the worker’s social position. Wage, being the price of the labor power, is determined by and connected to the value of it, that means to the amount of goods, services and spiritual values socially and historically needed for the re-production of the labor power. This value changes with the economic, cultural, scientific and technological development of society with an increasing trend. Just as an example: before smartphones appeared on the market, nobody felt the need of them, but after they soon became necessary to everybody. Prices never exactly reflect the values they originate from, due to the relation between supply and demand, principally, and other market conditions, secondarily. As the result of the production process restructuring (reorganization of the division of labor) and the technological replacement of labor power with machinery, labor supply generally exceeds labor demand and this objectively determines the permanent tendency to wage reduction under capitalism. This is one of the main contradictions of the capitalistic labor market: the labor power value historically grows, but the price of labor power (wage) tends to fall towards its physiological limit and, in some cases, even lower. Real wage depends not only on the amount of nominal wage, but also on many other variables, such as prices level and inflation, taxation, level of unemployment, everything can affect the relation between labor supply and demand. Even in the event if nominal wage rises, real wage may decrease by effect of price or taxation increase, or monetary devaluation, if their growth is more than proportional to the increase of nominal wage. As said before, proportional wage is a part of the distribution of the surplus value produced, along with profit. Given a certain amount of surplus value, if profit increases, wage automatically decreases. From this inverse proportionality of wage and profit the irremediable conflict objectively arises between labor and capital. On the one hand, in particularly favorable market conditions, an increase in both nominal and real wages may occur, but "... proportional wages may decrease even if the real wage rises together with the nominal wage, that is, together with the monetary value of labor, provided that it does not rise in the same proportion as the profit. If, as an example, in times of good business the wage increases by 5% while the profit increases by 30%, the proportional, relative wage has not increased, but decreased..."[8] On the other hand, it is a matter of fact that capitalism constantly improves labor productivity and intensity by applying new labor-saving technologies and forms of division of labor that allow to reduce the necessary labor time, needed to produce livelihood for the labor power reproduction, and expands the surplus labor time, from which surplus value and profit originate. Due to this, an objective tendency exists of the proportional wage to fall. Generally, even in those rare and short periods, when the real wage and the material living conditions of workers improve, this "...does not eliminate the contrast between the interests of the worker and the interests of the capitalist...",[9] because proportional wage has anyway decreased and the social gap with respect to capitalists has grown.

While capitalistic profit is firmly protected by the political power of the bourgeoisie, social disparities and the gap between the rich and the poor are increasing in Italy. Inflation is being artificially stimulated by the ECB and contributes to aggravating this situation, reducing the real wage, ie the purchasing power of workers. Moreover, provided the inverse proportionality between wages and rate of unemployment, the current high level of the latter causes an excess of labor supply over labor demand, that is generally structural, but is emphasized in crisis situations.

The above is confirmed by Tab. 3.1, based on OECD data, where average annual gross nominal wages, their index W and inflation (both in percentage yearly variation and index) are considered.

Tab. 3.1 – Average annual gross nominal wages (index and yearly variation) and Inflation (2005-2017)


Annual Average Wages

constant prices € 2017

W

Inflation

index 2005=100

%

%

index 2005=100

2005

29,630.33

100.00

0.00%

1.99%

100.00

2006

29,834.76

100.69

0.69%

2.09%

102.09

2007

29,805.48

100.59

-0.10%

1.83%

103.96

2008

29,837.94

100.70

0.11%

3.35%

107.44

2009

29,985.41

101.20

0.49%

0.77%

108.27

2010

30,272.54

102.17

0.96%

1.53%

109.92

2011

29,800.04

100.57

-1.56%

2.78%

112.98

2012

28,902.03

97.54

-3.01%

3.04%

116.42

2013

28,946.86

97.69

0.16%

1.22%

117.84

2014

29,055.92

98.06

0.38%

0.24%

118.12

2015

29,302.24

98.89

0.85%

0.04%

118.17

2016

29,512.07

99.60

0.72%

-0.09%

118.06

2017

29,213.56

98.59

-1.01%

1.23%

119.50

Source: OECD data, our elaboration

Source: OECD data, our elaboration

The wages' decrease is immediately evident even if we consider just nominal gross wages,[10] that fell by -1.41% compared to 2005 and by -3.5% compared to 2010. Despite the alarmist declarations of the ECB and the employers' organizations, actual deflation is in fact limited to 2016, with a price variation by only -0.10%. In all the other years considered, on the contrary, there is an average increase in prices by +1.54%, even if their annual variation is sometimes so weak as to confirm a depressive phase. For the purposes of our analysis, however, it is important to point out that the yearly variation of wages remains quite always below inflation, measured as the yearly variation of the consumer price index, except in 2014, 2015 and 2016.

If these are the dynamics of gross nominal wages, it is easy to guess, even without the need for graphs and tables, that the dynamics of real wages are far worse, if we consider:

  • the fiscal burden: tax rates on personal income and the income brackets for their progressingtaxation have been amended several times, but always in the name of reducing the tax burden on higher incomes; after the fiscal reform of 1974 we had 32 income brackets, the highest tax rate for incomes higher than 500 millions lira was 72%, the lowest was 10%; in 2018 we have 5 income brackets, the highest rate for incomes over 75,000 EUR is 43% (only on the part of income exceeding 75,000 EUR), the lowest is 23%; the tendency is to eliminate the concept of progressing taxation; it is no coincidence that the government Northern League - 5 Star Movement, representing a strongly export-oriented section of industrial capital, are trying to introduce the so-called flat tax, which has an incidence proportionally higher on lower incomes. Currently, if we take an average gross wage of 29,213.56 EUR (see Tab. 3.1), the incidence of direct taxation and social charges, paid by workers, is equal to 39% of it. Therefore, the wage net after taxes amounts to 17,820.27 EUR. However, what most strikes the workers and contradicts the principle of progressing taxation established by the Constitution is indirect taxes (VAT not deductible for final consumers, excises and duties on which VAT is often applied with multiplier effects of the final price, etc.), as they tax consumption regardless of income and mainly damages workers, obliged to spend the majority of their income for consumption of essential goods. During the period we are considering for our analysis, the VAT rate has increased from 20% to 21% in 2011 and to 22% in 2013, excises on alcohol, tobacco, gasoline and oil derivatives have increased almost once a year; stamp duty and registration duty have also increased, together with other various local levies;
  • the cut and privatizationof public basic services, from healthcare to education and transport: they became chargeable and their prices increased;
  • wage indexation is not calculated on the basis of actual inflation, but on the one programmed using the known accounting tricks.

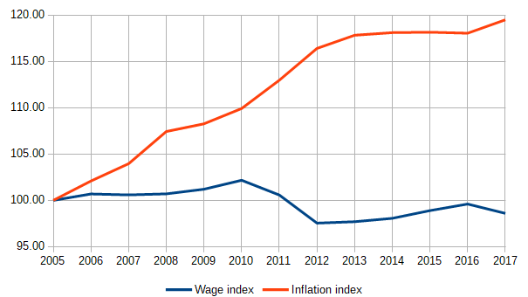
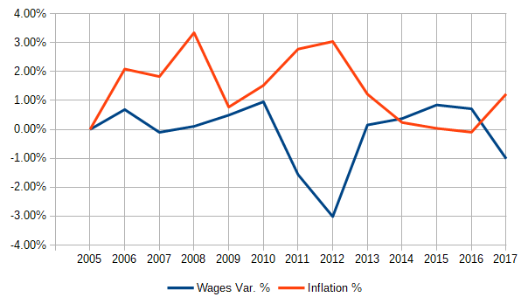
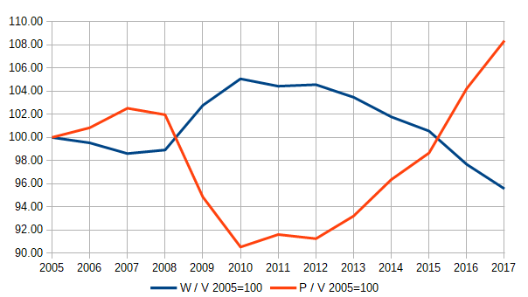
Considering the above, it is not difficult to understand that real wages decreased much more than nominal ones. Wage and inflation dynamics are shown in Chart 3.2 (long term variation) and Chart 3.3 (yearly variation).

Chart 3.2 – Average wage index and Inflation index

ICR-09-ITA06-EN

Chart 3.3 – Average wage annual variation and Inflation

ICR-09-ITA07-EN

The tendency of real wages to falling is not due to the will of the class of capitalists, but is an objective law of the capitalistic mode of production, mostly due to the labor supply generally exceeding the labor demand. In theory, real wages should not fall below the physiological level of subsistence and reproduction of labor power, but often, when a large “labor reserve army” is available and labor unions are weak or cooperating with the employers, wages may fall even below this extreme limit. It may happen in both developing and developed countries and generate the phenomenon of the so-called "working poor", that is workers, whose wages are not enough to guarantee their existence and the reproduction of their labor power. This is confirmed by what EUROSTAT reports, from which it also emerges that, thanks to the pension reforms imposed by big capital, 5.7 million Italians will receive a pension below the poverty line.

ICR-09-ITA08-EN

Across the EU Member States in 2016, the rate of employed persons at risk of poverty was highest in Romania (18.9%), followed at a distance by Greece (14.1%), Spain (13.1%), Luxembourg (12.0%), Italy (11.7%), Bulgaria (11.4%), Portugal (10.9%) and Poland (10.8%)”.[11]

Before starting the last part of this paragraph, some considerations are necessary. ISTAT, EUROSTAT, OECD, BCE, Bank of Italy, etc., gather and elaborate data, basing on National Accounting and non-Marxist economic theories and criteria. Many eminent Marxist economists have sought - and still seek - to elaborate official statistics data to quantify the Marxist economic categories. However, there is no unequivocal processing criterion and, for the moment, in capitalistic countries it is not possible to reach an exact quantification of the Marxist categories, but only approximate results.

The national accounting category that most closely approximates the concept of surplus value (S) is the added value (VA), which ISTAT defines as “the difference between the value of production and the value of intermediate costs”, calculated at basic prices, that means “the amount the producer receives from the sale of a good or service”.[12] The surplus value pertains to the sphere of production, while the added value, according to its definition given by ISTAT, is achieved through exchange and the market, after the transformation of value into price. Therefore, for the purposes of our analysis, to purify the added value from the effect of price fluctuations, it is necessary to calculate it at constant prices; nevertheless, a certain degree of approximation still remains.

According to the teachings of Marx, the rate of surplus value (σ), indicating the rate of exploitation of the labor power, is given by the ratio between the mass of surplus value (S) and the variable capital (W):

If, instead of surplus value (S), we place the added value (V) in the numerator, leaving in the denominator the variable capital (W), equal to the amount of wages paid, we obtain an approximate value of the exploitation rate (σ). Such a ratio is a kind of labor productivity rate (πL). Unfortunately, ISTAT, with its bizarre data classification criteria, provides us with a different labor productivity index, given by the ratio between the added value (V) and the hours worked (H), which can give only an extremely approximate idea of the rate of exploitation of the labor power, because it does not take into account the variable “wage” and is more a technical than a pure economic indicator. The same is true in relation to the rate of profit (ρ), given by the ratio between the surplus value (S) and the total capital, constant and variable, invested in advance (C + V): . The rate of profit (ρ) is approximately expressed by what ISTAT refers as to total factor productivity (πT). “The total factor productivity is defined as the ratio of the volume measure of value added and the total volume measures of capital, services and labor”.[13]

Tab. 3.5 shows the dynamics of the index LP of the labor productivity rate (πL) and the index TFP of the total factor productivity rate (πT), that we assume respectively as approximated expressions of the exploitation rate (σ) and the profit rate (ρ) referred to Industry macro-sector.

Tab. 3.5 - Labor Productivity per hour worked and Total Factor Productivity in Industry, based on value added, reference year 2010


LP

TFP

LP

2010

TFP 2010

chain index

reference year 2010

fixed base index

2010 = 100

2005

100.86

105.60

98.66

82.98

2006

102.45

107.31

94.79

87.63

2007

102.09

107.01

93.19

94.03

2008

100.87

104.51

93.50

100.62

2009

94.31

95.09

106.03

105.16

2010

100.00

100.00

100.00

100.00

2011

100.50

100.22

100.45

100.45

2012

102.82

100.93

101.16

101.16

2013

105.31

102.13

103.31

103.31

2014

106.09

102.60

105.99

105.99

2015

106.69

103.38

111.26

109.57

2016

107.45

104.49

123.80

114.50

2017

107.86

105.49

153.25

120.78

Source: ISTAT, our elaboration

Source: ISTAT, our elaboration

According to chain indices, both the Labor Productivity (LP) and the Total Factor Productivity (TFP), starting from the end of 2009, show a steady growing trend. After 2010, the growth of TFP is almost completely due to the significant growth of LP, that shows yearly increases, higher than those of TFP. During the whole period labor productivity has grown with an annual average variation of 2.80%, while the total factor productivity has grown on average by 2.93% per year. The fixed base indices of these two variables also show a steady tendency to growing after 2010. Totally, LP has grown by 43.27% and TFP by 45.56% compared with 2005. Chart 3.6 shows these dynamics in terms of annual variations, while Chart. 3.7 takes into consideration long term variations.

Chart 3.6 – LP and TFP in Industry, annual variations (2010=100)

ICR-09-ITA09-EN

Chart 3.7 – LP and TFP in Industry, total variation (2010=100)


ICR-09-ITA10-EN

Even if the labor productivity calculated by ISTAT is a very approximated expression of the surplus-value rate, that is the labor power exploitation rate, anyway it remains an indicator of the level of exploitation of labor power. As Marx has taught, any increase in labor productivity, no matter how measured, involves an increase of relative surplus-value and a decrease in relative wage. In fact, the increase in productivity involves a reduction in the working time necessary to produce the means of subsistence for the reproduction of the labor power and the consequent increase in the surplus labor time which generates greater surplus value, at the same total working time. At the same time, this involves a decrease of value of the means of subsistence and, finally, a decrease of value of the labor power itself, that will be reflected on its price, that is, on its wage. At the same mass of surplus value, if wage decreases, profit increasesaccordingly. This is clearly shown in Charts 3.6 and 3.7: the increase in LP involves a decrease in relative wages, that allows a related increase in profit, measured by TFP as an approximate measure of the rate of profit (see above). In other words, in the period considered, capital has almost entirely appropriated the result of the increase in productivity as profit, considering that even nominal wages decreased on average by -1,42% from 2005 to 2017.

As an empirical confirmation of what has been said so far and the Marxian theses on the multilateral dialectical relations between wage and profit, we report in Tab. 3.8 an interesting series of data concerning the "rewards" of labor and capital, that is the distribution of value added (VA) between labor and capital, oddly made available by ISTAT.

Tab. 3.8 – Wages and Profit percentage of Value Added to basic prices, annual and total variations, reference year 2005

Year

Wages

W / VA

Profit

P / VA

Wages

Profit

Wages

Profit

chain index current prices

fixed base index 2005=100

2005

64.00%

36.00%

100.00

100.00

100.00

100.00

2006

63.90%

36.10%

99.53

100.83

99.53

100.83

2007

63.50%

36.50%

99.06

101.67

98.60

102.52

2008

63.90%

36.10%

100.32

99.45

98.91

101.96

2009

66.60%

33.40%

103.90

93.03

102.77

94.86

2010

68.30%

31.70%

102.23

95.44

105.06

90.53

2011

68.10%

31.90%

99.40

101.19

104.43

91.61

2012

68.40%

31.60%

100.13

99.61

104.56

91.25

2013

67.90%

32.10%

98.96

102.15

103.47

93.21

2014

67.00%

33.00%

98.37

103.37

101.78

96.35

2015

66.40%

33.60%

98.79

102.38

100.55

98.65

2016

64.70%

35.30%

97.14

105.64

97.67

104.22

2017

63.50%

36.50%

97.84

103.97

95.56

108.36

Source: ISTAT, Conti Nazionali, Misure di Produttività, Serie per il calcolo delle produtività, our elaboration

Source: ISTAT, Conti Nazionali, Misure di Produttività, Serie per il calcolo delle produtività, our elaboration

Figures in Tab. 3.8 demonstrate, if still necessary, the inverse proportionality between wages and profit, as visually illustrated by Charts 3.9 and 3.10.

Chart 3.9 – Production factors rewards' percentage of added value to basic prices chain indices, annual variations

ICR-09-ITA11-EN

Chart 3.10 – Production factors rewards' percentage of added value to basic prices fixed base indices 2005=100, total variation


ICR-09-ITA12-EN

Chart 3.9 shows that the annual decrease in Profit percentage of value added (P / VA) in 2007-2009 (-5.93%) corresponds to a related, but less than proportional increase of Wages percentage of value added (W / VA, +3.25%). After 2009 the ratio P / VA uniterruptedly yearly increases rapidly by +1.68% on average, while the ratio W / VA decreases more slowly, by only -0.9% on average. Chart 3.10 takes into consideration the total variation throughout the period 2005 - 2017 of the factors' reward percentage of value added and shows that the ratio W / VA decreased totally by -4.44% compared to 2005 (-9.5% compared to 2010), while the ratio P / VA increased totally by +8.36% compared to 2005 (+17.83% compared to 2010). This confirms that, in the considered period, the part of value added (approximate expression of surplus-value) allocated for the reproduction of the labor-power, that is the wage, has decreased overall, while that distributed as profit has increased.

 It is interesting to notice, that the reciprocal of the W / VA ratio (percentage of added value for the remuneration of labor) is VA / W ≈ σ, ie the approximate expression of the rate of surplus value or rate of exploitation, which obviously has a trend, specularly opposite to that of the wages percentage of added value.

4. Final considerations

As seen, the first cause of the worsening of the life standard and the social position of the working class is not the crisis, but an objective law of capitalistic development, that is the tendency of wage to decreasing regardless of the economic conjuncture. Crisis only deepens and accelerates this tendency, whichpersists also in periods of economic recovery between one crisis and another. Capitalism copes with both its cyclical crises and its structural tendency of the rate of profit to falling mainly by increasing productivity, that is by intensifying the exploitation of the labor power and enlarging the profitabsolute value. That means the working class pays the cost of both capitalistic crises and recoveries. Therefore we must have no illusions: any improvement in the living and working conditions of the working class, in the context of capitalist relations of production, is more apparent than substantial, is aimed at supporting the capitalist market through consumption and is however temporary, in a context of general tendency to worsening in life standards and to increasing in social gap between capitalists and proletarians.

To make their economic and social achievements steady and definitive, the working class has no way, other than consolidating around itself a block of alliances with the other people's strata, even with some sectors of petty bourgeoisie, which have also been severely hit by both the capitalistic crisis and the capitalistic restructuring, in order to overthrow the power of the bourgeoisie, to establish the proletarian dictatorship, which will be the dominion of the majority of the exploited on the minority of the exploiters (the figures referred to in Chapter 2 confirm this ratio), and to start building Socialism-Communism.


[1] Source: ISTAT, our elaboration

[2] Source: ISTAT

[3] Source: OECD

[4] http://www.repubblica.it/economia/2018/05/08/news/agricoltura_il_made_in_italy_trainato_dagli_immigrati_senza_di_loro_il_nord_rischiereb-be_la_paralisi-195772027/

[5] Source: ISTAT, data published in the 2Q 2018, our elaboration

[6] Source: ISTAT

[7] Source: OECD

[8] K. Marx, Wage labor and Capital, p. 59 (translation from Italian).

[9] Ibidem, p. 60.

[10] OECD reports data from each country's national accounting, so that wages here are nominal, before taxes and deflated (at constant prices). We preferred to use OECD data better than ISTAT data because since 1992 ISTAT does not include tobacco products and some other fiscal monopoly commodities into the basket used for calculating the Consumer Price Index for Workers and Clerks Families (Index FOI). The remnants of wages indexation are connected to the “planned inflation rate”, for the calculation of which tax monopoly goods are excluded. The Ministry of Economy and Finance during these years several times has increased excise duties on goods subject to tax monopoly, such as alcohol, tobacco, oil and gasoline, to meet the need to raise funds, but this has not affected the new consumer price indices and, therefore, the wages indexation level. Another trick to alter national accounts at the expense of workers.

[11] https://ec.europa.eu/eurostat/web/products-eurostat-news/-/DDN-20180316-1

[12] ISTAT, Conti Nazionali, Produzione e valore aggiunto, Metadati

[13] Ibidem